
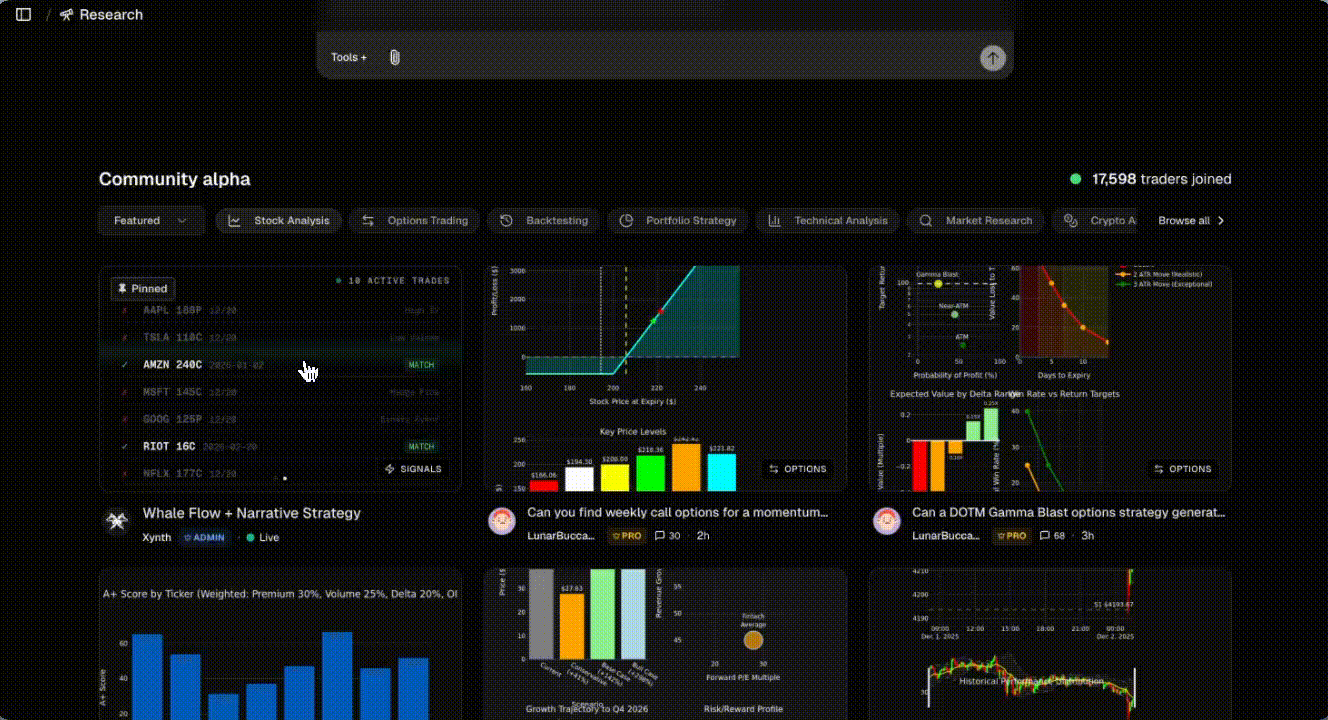
Whale Options Flow + Narrative Strategy
Track institutional options activity and surface high-conviction directional bets.
What This Strategy Does
Large institutions and hedge funds place massive options bets—often $50,000 to $10,000,000+ per trade. These "whale" trades can signal where smart money thinks a stock is headed. But not every big trade is a directional bet. Many are hedges protecting existing positions, and without filtering, you're just following noise.
This workflow merges institutional order flow with AI cognitive processing to trade only when the math and the media agree. It finds the trades that look like genuine conviction bets, validates them against price trends, runs AI-powered news analysis across Reddit, X, and financial news, then ranks them by risk/reward so you can focus on the best opportunities.
The strategy description says it best: "Merges institutional order flow with AI cognitive processing to trade only when the math and the media agree."
The Pipeline: Step by Step
Each step is a "node" in the workflow. Click any node in the app to see exactly what it does, the code running, and the output it produces.
1. Whale Radar - Flow Detection
Finding the big money
We scan 200+ recent options trades from institutional desks. Only trades with $50,000+ in premium make the cut—this filters out retail noise and focuses on trades from funds with real capital at stake. These aren't retail gamblers; they're funds with $10M+ AUM making calculated bets.
What we're looking for:
- Trades within 90 days to expiry (where conviction is highest)
- Clustering by ticker, expiry, and direction (CALL vs PUT)
- Volume/OI ratios above 2.0x (unusual activity)
Real example from recent run: SPX CALL expiring Jan 2026 with $10,078,200 total premium at strikes 7000-7100. That's institutional conviction.
Output: ~50 whale clusters with ticker, direction, expiry, total_premium, and whale_strikes—showing exactly where institutional money is concentrating.
2. Smart Hedge Filter - Flow Sentiment
Separating bets from protection
Not every big options trade is a directional bet. ~40% of large options trades are hedges—portfolio protection, not conviction plays. We filter these out by cross-referencing flow with price trend.
For each of the 50 whale clusters, we fetch current price, SMA-20, and aggregate call vs put premium to determine flow sentiment.
The filter logic:
- Bullish flow + downtrending stock = likely a hedge → REJECT
- Bearish flow + uptrending stock = likely a hedge → REJECT
- Flow direction matches price trend = genuine conviction → KEEP
Real example: TSLA PUT cluster with $1.89M premium, but flow_sentiment shows BULLISH (call_premium $1.1B vs put_premium $504M). The whale PUT might be a hedge against a larger long position.
Output: Each cluster now has signal_type (BREAKOUT_LONG, etc.), confidence level, price, SMA-20, price_trend, flow_sentiment, and call/put premium breakdown.
3. IV Filter & Strike Selection
Avoiding the IV trap
Just because whales are buying doesn't mean the options are cheap. High implied volatility (IV) means you're paying a premium that might not be justified. We check IV percentile to avoid overpaying.
IV Filter:
- Reject if IV > 70th percentile (options are overpriced)
- Select ATM strikes with delta ~0.50-0.60 for better probability
- Track whale_avg_strike to see where institutions are positioned
Real example: TSLA CALL at $425 strike with IV percentile of only 21.6% (cheap!), delta 0.60, premium $9.65. The whale strikes cluster at 425-430, and total whale premium is $586K.
Output: ~57 candidates with selected_strike, delta, premium, iv_percentile, current_iv, whale_strikes, and whale_avg_strike.
4. Narrative Validation & Risk Check
AI-powered news analysis
This is where AI does the heavy lifting. For every ticker that made it through the filters (usually 50+ stocks), we run parallel searches across Reddit, X (Twitter), and financial news. All of that content gets fed through GPT to extract the narrative—what's actually driving the stock.
The AI looks for specific narrative types and flags risks that could blow up your trade:
What the AI extracts:
- Narrative Type — CATALYST_DRIVEN, MACRO_SECTOR, BAD_NEWS_DUMP, or UNKNOWN
- News Sentiment — Scored from -1.0 (bearish) to +1.0 (bullish)
- Binary Risk — Flags if there's an earnings, FDA decision, or major event in the next 7 days
- News Summary — Plain English explanation of what's happening with the stock
For example, TSLA might show: "BAD_NEWS_DUMP, sentiment -0.85, Tesla faces intense bearish pressure as analysts highlight collapsing margins..." — now you know the whale bet is fighting negative sentiment.
Output: Each signal now has narrative_type, news_sentiment, binary_risk, and news_summary fields—you understand WHY the whale might be betting.
5. Strategy Builder & Time Buffer
The Breathing Room Protocol
Whales have capital to burn on short-dated OTM options. Retail doesn't. We optimize entries for higher probability trades by adjusting strikes and expiries.
Expiry Optimization:
- Shift +14 days minimum from whale expiry for breathing room
- Optimize strike to balance delta and premium cost
- Generate structure_suggestion (e.g., "Long CALL @ 437.5")
Real example: TSLA whale bought $425 calls expiring Dec 5. We shift to $437.5 strike expiring Mar 6—more time for the thesis to play out, better risk/reward.
Output: Each signal now has optimized_strike, optimized_expiry, and structure_suggestion.
6. Final Rankings & Visualization
The best opportunities
Every strategy runs through the options P&L calculator to get hard numbers before ranking. We generate interactive P&L charts and heatmaps for each signal.
Metrics calculated:
- Max Profit — Best case scenario (e.g., $19,253)
- Max Loss — Worst case / your risk (e.g., $1,366)
- Probability of Profit — Statistical chance of making money (e.g., 32.7%)
- Net Cost — Capital required to enter (e.g., $1,152)
- Breakeven Price — Where you start making money (e.g., $326.53)
- Avg Implied Volatility — Current IV of the position
Real example: JPM Long CALL @ $315 expiring Feb 20 — Max Profit $13,636, Max Loss $1,152, PoP 32.7%, Breakeven $326.53. Full P&L chart and heatmap included.
Output: Top 10-11 ranked signals with full metrics, interactive P&L charts, and heatmaps. Click any signal to see the complete breakdown.
Demo
💡 Tips for Using This Signal
- Check back every 4 hours — The workflow runs automatically and surfaces fresh opportunities throughout the day.
- Click signals for details — Each signal has a full breakdown with P&L projections, Greeks, and the reasoning behind it.
- Do your own research — These are discovery points. Validate the thesis before trading.
- Watch position sizing — The "Cost" metric shows capital required. Size appropriately for your account.
- Note the expiry — Shorter expiries move faster but have less time for the thesis to play out.
⚠️ Important Reminders
- Not financial advice — These signals are for discovery and research purposes only.
- Whales can be wrong — Institutional traders lose money too. No signal is guaranteed.
- Past performance ≠ future results — Market conditions change constantly.
- You make the final call — Xynth surfaces opportunities; trading decisions are yours.
Related: Learn more about Signals & Workflows and how to navigate the interface.